Stop the Bus, I Need a Wee-Wee!
Apparently that song has other verses??
Abstract
During 2024, a list of visits to the bathroom was logged with data on datetime and burstingness. Various analyses were produced to present various aspects of the data, primarily for the purpose of being silly. 947 "number ones" and 223 "number twos" were had over a 365-day period, the largest proportion of which were at home and between 6-7am. Finally, we also present a "Number, Clump, Spread Analysis" on the timestamps collected.
Introduction and Collection Methods
There's really not much to be said here. I genuinely have no idea why I started recording all this data in specific! The log dates back to late December 2023, which is quite a nice timeframe as it gives me a clean year. This entire document is completely non-serious, and really just an excuse to squeeze as many euphemisms in as possible.
All data in this article are cut off at the 30th of Dec (I'm currently writing this at 2am on New Year's Eve) but because this year was a leap year it still works out to be 365 days. Each datum in the datalog consists of a datetime, type, location and burstingness. Type is whether it's a "number one" or a "number two". Location refers not to a specific toilet but a slightly more generic place - like "home" or "the English corridor". Burstingness is rated out of 5, where
- 1 = I didn't know I needed it
- 2 = a slight nagging
- 3 = I needed that
- 4 = stop the bus I need a wee-wee
- 5 = gotta riverdance to stay sane
I did log timezones (i.e. when I went abroad, I logged the update to relative time but wrote data in local time) but these have all been ignored, so there are going to be some very minor and very occasional offsets. You'll barely notice them.
Summary and Highlights
- I went to the loo* 1170 times this year
- 947 of which were number ones (2.6 times a day)
- 223 of which were number twos (4.3 times a week)
- *I actually only went to the loo 1010 times this year: 160 visits involved both a number one and a number two
- The vast majority of these visits happened at home while roughly a sixth happened between 6-7am
- Most number ones were ranked 3 burstingness, whereas most number twos were ranked 4
- A period of intense loo-age was evident in June
The Age-Old Wisdom
As a knowledgable sage once told me, "Poopoo Time is Peepee Time but Peepee Time is not [Always] Poopoo Time" This obviously seemed correct at the time but now we can prove it! As was mentioned in the highlights, 160 of my loo visits incorporated both a number one and a number two (in any order, within ten minutes of one another, although only 7 of these happened 2-10 minutes apart - most were just a minute apart). This means that 72% of "Poopoo Times" were "Peepee Times". Obviously when this wizard said this, the implication was that it wasn't every single one (that would be easy to disprove as it only takes one), but the vast majority is pretty good evidence. The other half of the statement is easy to prove: for every number two, there were at least four number ones (4.24 to be precise) and thus by the Dirichlet Principle (which has a much fancier name than it deserves - don't Google it because you'll be underwhelmed) there will always be a "Peepee Time" that cannot be a "Poopoo Time". Specifically, 83% of them were. But, that half of the adage is still 100% true. Therefore, the legendry is roughly 86% true. Good enough for me.
How badly?
Each toilet visit is qualified with a "burstingness" score between 1 and 5 (scroll up to see the benchmarks - I can't be bothered to repeat them). Most were 3s and 4s, which makes sense because why empty the tank if it's not full? Similarly, why wait until it's so uncomfortable that you have to riverdance? Apparently I was much more willing to do so with number twos than ones:
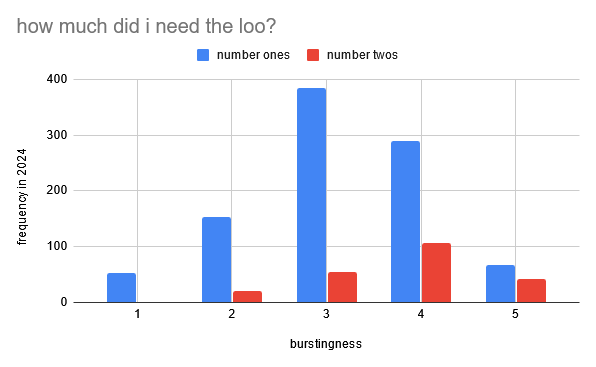
The reason I put this section here (rather than somewhere below in the less important stuff... as if any of this is important) was because there are some interesting relations between the "burstingness" score and the crossovers of number ones and twos discussed in the first section:
There were 53 number ones with a burstingness of 1 (ie "I didn't think I needed to go"), but 52 of these happened within ten minutes after a number two, thus backing up the claims discussed in the previous section even further. Similarly, there were 153 number ones with a burstingness of 2 (ie just-perceptible), but most of these happened within ten minutes of a number two. In fact, of most visits involving both water and fertiliser, I much more needed to do the latter than the former, and the vast majority of number ones involved in a situation like this were not very bursting. This adds further evidence to the claims discussed in the previous section and passed down through the generations.
How Often?
This is the important question, really. I have a friend who drains the radiator more times in a day than I have fingers to count on - when they get through our triple lesson (which features majorly in my article on "Number, Clump, Spread" - go read that! Shameless self-insert!) without going to the loo, this is something to write home about. I, on the other hand, am notorious for rarely going to the loo. The longest I believe I went this year was 29 hours and 41 minutes, although that's harder to verify than I can be bothered. For the record, I had seven number ones in a day on multiple occasions! (It was terrible!) But to give a more specific answer, I will answer through the powerful medium of a Google Sheets graph that I whipped up in the dead of night!
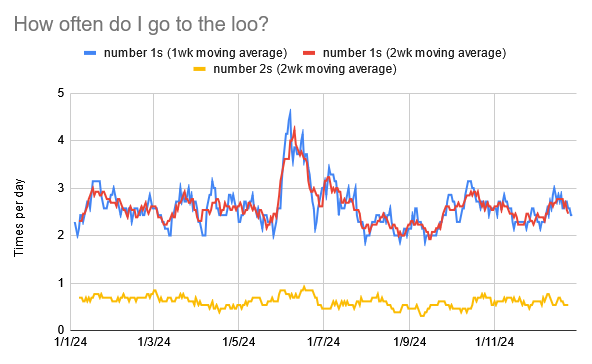
Looking more closely, there are some interesting things to be revealed. My bowel patterns were much more stable, although they did roughly mirror some of the more drastic changes in urinary movements in places. To address the elephant in the room, there was a massive spike during June where I almost doubled my number ones at a point. Both 7-number-1s (and both 6-number-1s) occurred during June. This is simply because June is hayfever season, so I drink loads of water to keep my mucus nice and runny so that I can breathe more easily, but it does go through me quite quickly....
The other interesting pattern that took me by such a large surprise was the oscillations that seem to occur. They're visible throughout at regular and almost predictable intervals, but particularly around August/September sorta time. This reminded me strikingly of this pattern that occurred during study leave one year:
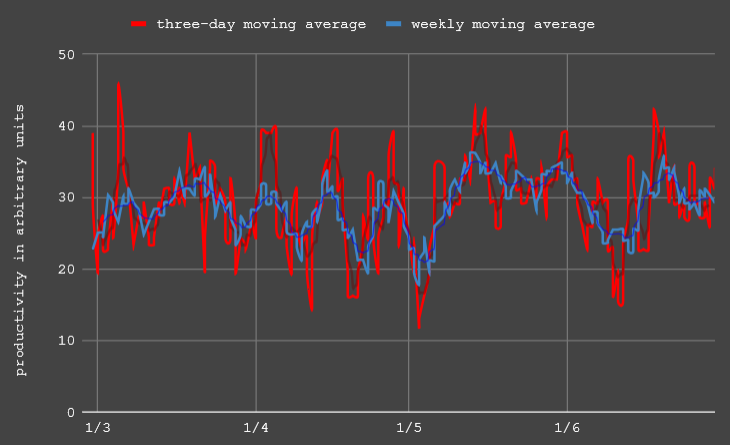
To give a little context, this was part of a larger challenge I held with a friend to see who could be most productive during study leave (mostly with respect to studying but also other things like self-care and hobbies). For the record, I won this year (reclaiming my loss from the previous year's study leave). But probably only because of the extremely long plateau of productivity around mid-late May where two oscillations fused together.
But oddly, the oscillations in this productivity graph match the oscillations in the number of pennies I spend (once you account for things like different moving average periods, phase offset, etc). I wonder if there's something really afoot here - probably just statistical bias (if I'm more productive I work harder so drink more water....??) but any correlation would be interesting. In the same way that I analysed similar (but different) data in my "Number, Clump, Spread" article to help plan my time in the long-term, I wonder if there's any merit in analysing when powder my nose to help me plan my time... Probably clutching at straws here. I have much better data for September-December (where the oscillations are clearest in both moving averages) in terms of productivity (as part of the same dataset as the "focability" data used in my "Number, Clump, Spread" article - go read it!! Shameless self-insert!) but I can't entirely be bothered to analyse it this instant.
When and Where?
At what time of day did I wring out the ol' kidneys most? 06:06am. 12 wazzes occurred at 6 past 6 in the morning in 2024. 8.2% of all my visits took place between 06:00 and 06:20am, while 16.9% took place between 6 and 7 o'clock. This is hardly surprising as I got in a good habit this year of getting up at 6 on the dot (although I slipped quite a bit in the latter part of the year).
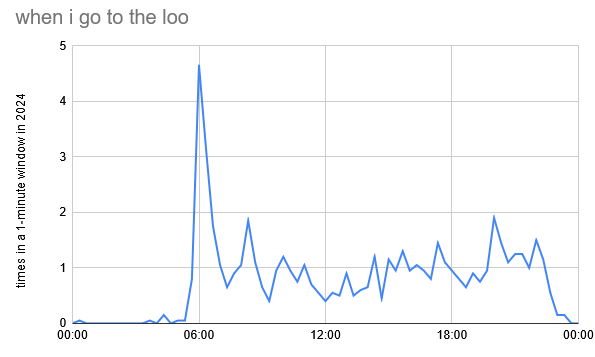
Most of the other larger spikes on this graph are labellable. the second one is 08:20-08:40, roughly when I have my breakfast on the weekend. There are peaks at 13:00-13:20 (the beginning of lunch at school) and 14:20-14:40 (roughly when I leave school on a lot of days, but also roughly 8 hours after my first number one of the day if I'm at home). There's an extended portion of the day where I have a lot more (variously between 3pm and 9pm) because that's usually when I get home. The peak at 8pm is inexplicably high. Aside from that, it all seems that my body runs on surprisingly regular clockwork.
But where do I test the plumbing most? As just mentioned, when I wake up and when I get home are two of my favourite times to pay a visit to the ol' porcelain, so it's unsurprising that 4 in 5 of nature's calls occur at home. (Wow, sounds like a firefighters' campaign.)
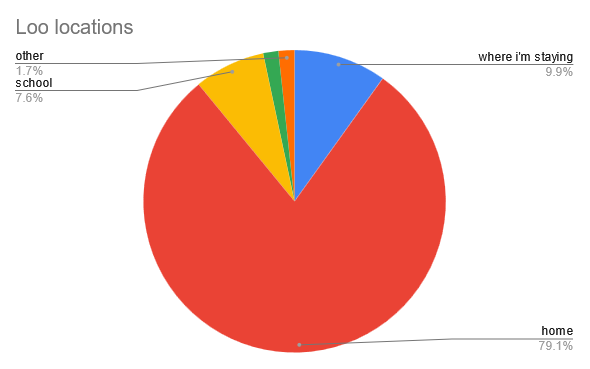
Aside from the massive proportion that happen at home (it could happen to you too!), the biggest proportion is just wherever I'm staying at the time (defined as somewhere I overnighted) which makes sense because it's just a stand-in for home. The biggest sub-category hereof was my exchange partner's house, where I stayed for two weeks, but my aunt also featured quite highly.
Of the thirteenth that happen at school, my favourite haunt is the loos in the English corridor, which warranted 47 visits this year. Probably just because it's nearest to the DT department.
The tiny 1.7% miscellaneous slice is where it gets interesting: most are at friends' houses or non-school institutions where I was visiting. The equally poignant component is the green slice, which for some reason Google refuses to label. These are public loos! I used 18 different public bogs 19 times (only four on trains or in stations, surprisingly) - the only one I could stomach going back to was on Bournemouth beach. I think there's an ode to be given to public loos from the fact that I used them more than my friends', but I'll leave my less fortunately bladdered friend to write such an ode.
NSC
For the umpteenth time in this article, I'm going to reference my other article on "Number, Clump and Spread", which was also written as part of the Fact of the Day Finale series. I implore you to read at least part of it before fully understanding this bit, although I'll attempt to give a layperson's interpretation too. (The values account for number ones only and are given in HH:MM:SS format for your convenience. I'll take applause at the end.)

The value of mu (the mean) is very simply the mean interval between two rainstorms on the bowl - you may recognise that value as the reciprocal of the number i mentioned earlier, 2.6 per day.
The value of mu_c (the "clump-weighted mean") represents the mean time passages between water passages, but weighted in favour of close-together instances. It's a measure of how much a role closely-packed events form in your data, and of short-term distribution: here, it's quite a lot but still quite a few hours so nothing to write home about.
The value of mu_s (the "spread-weighted mean") represents the mean duration between urination station visitations, but this time weighted in favour of "poorly-spread" instances. It's a measure of poorly-distributed events in your data in the long term: here it's very close to the standard mean, albeit a little bit above, implying that there are certainly some drier stints than others but on the whole it's very well-spread. Which makes sense.
The same analysis couldn't be conducted for slices of caterpillar cake as easily on the entire dataset due to its poor formatting and my laziness at this dark hour of night. However, small-scale testing yields two results:
- It was better spread and even better clumped compared to the tinkle.
- A surprising number of them occurred at similar times but one or two days apart!
I'm afraid I don't really have anything more to say in this article. It's all a bit silly. As ever, if you have any ideas what to do with all this data (any analyses you think might be interesting?) or any ideas for future data-collection, please let me know ASAP!! I love spreadsheets.....
Oh and go and read the other three articles. They're much more purposeful. Ok maybe not purposeful....